WMS:Overview of Floodplain Delineation
In addition to stream network and drainage basin delineation, WMS can also be used to perform floodplain delineation. Water levels simulated by a river hydraulic model or collected from different sources are read from a text file as a scatter dataset (see preparing stage data for more help). A smooth water surface is constructed by interpolating water levels at TIN vertices. User specified flood barriers such as embankments, roads, etc are also considered during this process. This surface is then intersected with the triangles in TIN representing the ground elevations, and the resulting set of edges defines the floodplain.
The basic steps to performing a floodplain delineation in WMS include:
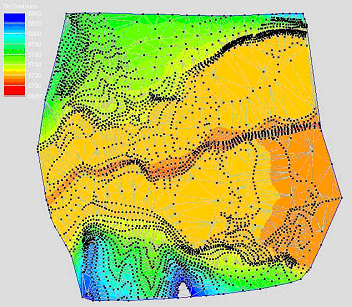
- Prepare a triangulated irregular network (TIN) surface of the area where the delineation is to be performed. This can be done by reading scattered elevation, converting from a DEM, or digitizing a contour map.
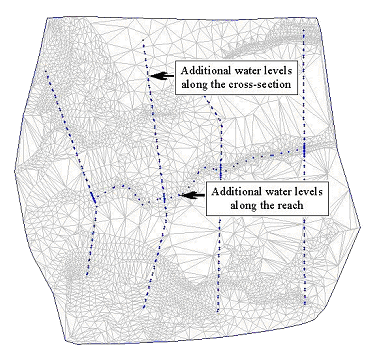
- Prepare the water surface elevation data. Water elevations data consists of a series of surface water elevations points defined as x, y, z (where z is the elevation of the water surface). Such points could be the results of a hydraulic model simulation, calculated in the WMS channel calculator, or retrieved from a known gaging station. They are stored as a scatter dataset.
- Select the appropriate options for delineating the floodplain, including the possibility of using a barrier coverage, and then delineate the flood.
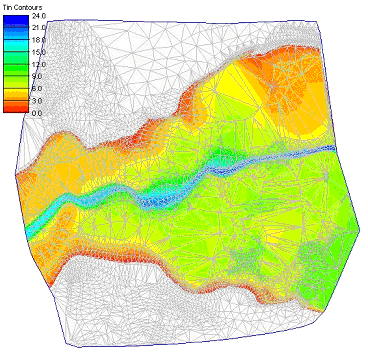
- The result of the floodplain delineation will be a new dataset of water surface elevations and/or inundation depths. These datasets can be used to display contours on the TIN and converted to a series of output coverages (maps), including a flood depth map and impact maps derived from two separate delineations.
Stochastic Modeling
The floodplain delineation tools are connected with the HEC-1 hydrologic model and HEC-RAS hydraulic model to perform a series of floodplains based on the results of a series of model runs where rainfall, CN, and Manning's are varied stochastically within a range of valid results.
Flood Menu
The Flood menu has the following commands:
- Read Stage File – Brings up an Open dialog for importing a stage file.
- Delineate – Opens the Floodplain Delineation dialog.
- Interpolation Options – Brings up the 2D Interpolation Options dialog.
- Risk Analysis – A submenu with the following commands:
- Return Period → Feature Objects – Opens the Return to Feature dialog for generating contours from the AEP map for specified return periods.
- Conversion – This submenu contains a number of commands for converting a delineated floodplain dataset to a map coverage.
- Flood → Extent Coverage – Brings up the Flood Extent Coverage dialog for conversion to a flood extent map coverage.
- Flood → Depth Map – Brings up the Flood Depth Coverage dialog for conversion to a flood depth map coverage.
- Flood → Impact Map – Brings up the Flood Impact Coverage dialog for conversion to a flood impact map coverage.
- Stochastic Modeling – Opens the Stochastic Run Parameters dialog.
- Run Stochastic Model – Launches the stochastic model wrapper and starts the stochastic simulation run.
Differences From Earlier Versions (Version 6.0 and earlier)
The new method differs from the previous method in several aspects. The locations of water levels and their section criteria for interpolation are more flexible than the previous method. Ability to incorporate user defined flood barriers as coverage provides an excellent opportunity to overcome the limitations inherent in digital terrain models. It also becomes useful in evaluating “what if” or post project scenarios. The new method provides several options to present flood depth data that are not available in the older method. In addition to conceptual and computational differences between two methods, also notice the following changes while using the new method:
- Water levels are read as a scatter dataset as opposed to flood stages at TIN vertices.
- The method does not require “streams” in the TIN.
- Multiple events or water level time series can be read as oppose to a single event. Choose an event while delineating floodplain.
- Specify flood barriers as features in the flood barrier coverage and the new method incorporates those features during flood depth computation.
- Computed flood depths are stored as TIN dataset and saved along with the TIN.
- Multiple flood depth datasets can be created in a TIN from multiple events.
- In addition to displaying flood depth as contours, this method can also create flood extent and classified flood depth coverage.
- It is now possible to compare two different flooding scenarios by creating a flood impact coverage.
- Finally flood extent, classified flood depth, and flood impact coverages can be exported as shapefiles for reporting or other flood management purposes.
Related Topics
- Delineate Floodplain
- Preparing Stage Data
- Stochastic Modeling
- Hydraulic Modeling
- Interpolation Options for Floodplain Delineation
- Simplified Dam-Break Analysis
- Flood Barrier
WMS – Watershed Modeling System | ||
|---|---|---|
| Modules: | Terrain Data • Drainage • Map • Hydrologic Modeling • River • GIS • 2D Grid • 2D Scatter |  |
| Models: | CE-QUAL-W2 • GSSHA • HEC-1 • HEC-HMS • HEC-RAS • HSPF • MODRAT • NSS • OC Hydrograph • OC Rational • Rational • River Tools • Storm Drain • SMPDBK • SWMM • TR-20 • TR-55 | |
| Toolbars: | Modules • Macros • Units • Digitize • Static Tools • Dynamic Tools • Drawing • Get Data Tools | |
| Aquaveo | ||


