SMS:Map Module Display Options: Difference between revisions
No edit summary |
|||
| (69 intermediate revisions by the same user not shown) | |||
| Line 1: | Line 1: | ||
{{Template:Infobox SMS Map Module}} | {{Template:Infobox SMS Map Module}} | ||
The properties of all map data that SMS displays on the screen can be controlled through the ''Map'' tab of the [[SMS:General Display Options|''Display Options'' ]]dialog. This dialog is opened by right-clicking on the [[ | The properties of all map data that SMS displays on the screen can be controlled through the ''Map'' tab of the [[SMS:General Display Options|''Display Options'' ]]dialog. This dialog is opened by right-clicking on the Map Data [[File:Map Folder.svg|16 px]] entry in the Project Explorer and selecting the '''Display Options''' command. (It can also be accessed from the from the ''Display'' menu or the '''Display Options''' [[File:Display Options Macro.svg|16 px]] Macro.) | ||
The exact layout of the ''Display Options'' dialog for feature objects depends on the active | The exact layout of the ''Display Options'' dialog for feature objects depends on the active coverage type. Some options are available on all coverages, while other options are only available on certain coverage types. The following options are available in the ''Display Options'' dialog. The entities associated with the map module with display options are shown below. Some of these entities also show an '''Options''' button to the right. For these entities, additional display controls are available. The available map display options include the following: | ||
[[Image:SMS Map Display.png|thumb|450 px|''Display Options'' dialog showing ''Map'' options with FESWMS coverage]] | |||
[[Image:SMS Map Display. | The visibility of feature objects can be controlled in this section. The following options are available: | ||
* ''Node'' or ''Point'' – Display the vertices along the nodes or points. The button next to this option allows opening a [[SMS:Display_Options#Symbols|''Symbol Attributes'']] dialog to define the size and shape of the nodes or points. | |||
* Node | * ''Nodal BC'' or ''Point BC'' | ||
** ''Refine Points'' | |||
* Nodal | * Node or Point ''ID'' – Display the ID of the feature node or point. The button next to this option allows opening a [[SMS:Display_Options#Font|''Font'']] dialog. | ||
* | * ''Arcs'' – Display of feature arcs in the Graphics Window. The button next to this option allows opening a [[SMS:Display_Options#Line|''Line Attributes'']] dialog where the style, width, and color of the arc can be selected. | ||
* | * ''Arc BC'' – Activates an '''Options''' button that opens the ''Arc Display Options'' dialog with display options for the boundary condition specific to the active coverage. | ||
* | * ''Vertices'' – Display the vertices along the arcs. The button next to this option allows opening a [[SMS:Display_Options#Symbols|''Symbol Attributes'']] dialog to define the size and shape of the vertices. | ||
* Arc ''ID'' – Display the ID of the feature arcs. The button next to this option allows opening a [[SMS:Display_Options#Font|''Font'']] dialog. | |||
*Arc ''Annotations'' – Displays the arc direction and station. Clicking the '''Options''' dialog will bring up the ''Arc Annotation Options'' dialog. | |||
* ''Arc Types'' – Arc attributes may be displayed depending on the coverage. | |||
* ''CL Flow Direction Arrow'' – Display an arrowhead showing the direction of center line arcs. | |||
* ''Polygon Fill'' – Display the fill color of feature polygons. Generally the fill color matches the [[SMS:Materials Data|material data]] assigned to the polygon. | |||
* Display of | ** Polygon ''Transparency'' – Sets a transparency value for the polygon fill. | ||
** Show Materials / Mesh Type – Fill the polygons to display the materials assigned to the polygons or the mesh generation type assigned to each polygon. | |||
** Material Opts – Set the display options of the materials. | |||
** Land / Ocean – Set the color fill of land and ocean polygons. (Cartesian grid coverages only) | |||
* | * Polygon ''ID'' – Display the ID of the feature polygons. The button next to this option allows opening a [[SMS:Display_Options#Font|''Font'']] dialog. | ||
* | * Grid ''Frame'' – Set the display of the grid frame. (Cartesian grid coverages only) The button next to this option allows opening a [[SMS:Display_Options#Line|''Line Attributes'']] dialog where the style, width, and color of the grid frame can be selected. | ||
* ''Legend'' | |||
* ''Inactive Coverages'' – Set the color for the display of all inactive coverages. | |||
==Annotations== | |||
[[File:ArcAnnotationOptions.png|thumb|300 px|The ''Arc Annotation Options'' dialog]] | |||
Display the | The ''Arc Annotation Options'' dialog is reached by clicking the '''Options''' button next to the ''Annotations'' options in the ''Map'' tab of the ''Display Options'' dialog. The dialog has the following options: | ||
* ID – Display the ID of the feature arcs. | *''Direction'' – This section allows turning on and off arc direction arrows. | ||
* | **''Show arc direction arrow'' – When checked on, arc direction arrows will appear on feature arcs. | ||
* Arc | *''Ticks'' – This section allows defining tick marks on feature arcs to show the different lengths along the arc. Ticks only display if the project units are set to feet or meters. Ticks only be displayed for "Observation", "1D Cross Section", "1D Centerline" or "Plot Data" coverage types. | ||
* | **''Major Ticks'' – Major ticks can be set to be displayed in one of the following location on the arcs: | ||
***"None" – No tick marks are displayed. | |||
***"Cross" – Tick marks are displayed across the arc lines. | |||
***"Left" – Tick marks are displayed only on the left side of the arc based on the arc direction. | |||
***"Right" – Tick marks are displayed only on the right side of the arc based on the arc direction. | |||
* | **''Spacing'' – Assigns the space between major ticks. | ||
* Polygon | **''Length'' – Assigns the length of major tick marks. | ||
* Show Materials / Mesh Type – Fill the polygons to display the materials assigned to the polygons or the mesh generation type assigned to each polygon. | **''Decimal places'' – The number of decimal points for each major tick mark label. | ||
* Material Opts – Set the display options of the materials. | **''Number of minor ticks per major tick'' – How many minor tick marks are included between each major tick mark. | ||
***''Minor tick spacing'' – Show the spacing that will be used for minor tick marks. | |||
**''Tick labels'' – Turns on and off the tick labels. Clicking the '''Font''' button next to this option will open a ''Fonts'' dialog where the label font style can be changed. | |||
Set the display of the grid frame | |||
Set the color for the display of all inactive coverages. | |||
==Legend== | ==Legend== | ||
[[File:SMS Map Legend Options.png|thumb|300 px|Map Module Display ''Legend Options'' dialog]] | |||
Turn the legend on or off for feature objects. The '''Options''' button opens a dialog that controls the title, font, location, and size of the legend. The '''Active''' button in this dialog signifies to show only the active coverage in the legend and the '''All''' button signifies to show all coverages in the legend. | Turn the legend on or off for feature objects. The '''Options''' button opens a dialog that controls the title, font, location, and size of the legend. The '''Active''' button in this dialog signifies to show only the active coverage in the legend and the '''All''' button signifies to show all coverages in the legend. | ||
The ''Legend Options'' dialog has the following options: | |||
* ''Title'' – Allows entering a name for the legend. | |||
* ''Font'' – Clicking the button in this section brings up a ''Font'' dialog to set the attributes of the legend text. | |||
* ''Size'' | |||
**''Width'' | |||
**''Height'' | |||
*''Location'' – Allows defining the location for the legend in the graphics window. Options include: "Top Left Corner", "Bottom Left Corner", "Top Right Corner", "Bottom Right Corner", "Screen Location", or "World Location". Using the "Screen Location" or "World Location" option will activate the ''X location'' and ''Y location'' options where a more precise location can be specified. The "World Location" option will also activate the ''Z location'' option. | |||
== | ==Observation Coverage Only== | ||
*''Calibration Target'' – Turn on/off calibration targets drawn next to observation points. The Interval and Two std. dev. options tell SMS to set the size of the calibration targets based on the interval or the standard deviation assigned to each point. The Scale tells SMS to scale the targets larger (>1.0) or smaller (<1.0) than the default size. | |||
*''Computed'' – Tells SMS to ''Use the active dataset'' or to ''Use the selected dataset''for displaying the calibration targets. | |||
*''Observed'' | |||
== | ==Obsolete Options== | ||
*'' | The following was removed in SMS 13.1, but is available in SMS 13.0: | ||
* [[SMS:Snapping#Snap_Preview_of_Feature_Objects_to_a_Geometry|''Snap Preview'']] – Turns on or off the display of the where a feature object will align along a grid or mesh. Requires that the coverage be linked to a [[SMS:Simulations|simulation]]. The rules for snapping vary depending on the coverage type, therefore, the snap preview may change when switching between coverages linked to the same simulation. ''Shift + Q'' can be used to turn on or off the preview mode without entering the ''Display Options'' dialog. | |||
==Related Topics== | ==Related Topics== | ||
| Line 69: | Line 72: | ||
{{Template:Navbox SMS}} | {{Template:Navbox SMS}} | ||
[[Category:SMS Display Options|Map Module Display Options]] | [[Category:SMS Display Options|Map Module Display Options]] | ||
[[Category:SMS Map| | [[Category:SMS Map|Display Options]] | ||
[[Category:SMS Map Dialogs]] | [[Category:SMS Map Dialogs|Display]] | ||
[[Category:SMS Display Dialogs]] | [[Category:SMS Display Dialogs|Map]] | ||
Latest revision as of 22:01, 26 March 2024
| Map Module | |
|---|---|
 | |
| Map | |
| Feature Objects | |
| Coverages | |
| More | |
| Map Module Interface | |
| Map Display Options | |
| Map Module Tools | |
| Feature Objects Menu | |
| Map Project Explorer | |
The properties of all map data that SMS displays on the screen can be controlled through the Map tab of the Display Options dialog. This dialog is opened by right-clicking on the Map Data ![]() entry in the Project Explorer and selecting the Display Options command. (It can also be accessed from the from the Display menu or the Display Options
entry in the Project Explorer and selecting the Display Options command. (It can also be accessed from the from the Display menu or the Display Options ![]() Macro.)
Macro.)
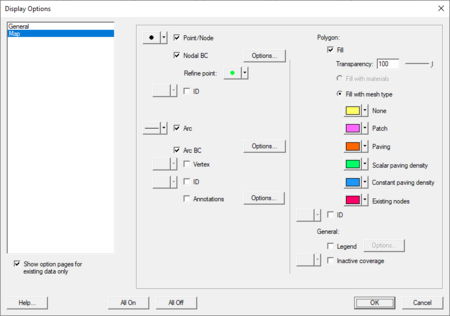
The exact layout of the Display Options dialog for feature objects depends on the active coverage type. Some options are available on all coverages, while other options are only available on certain coverage types. The following options are available in the Display Options dialog. The entities associated with the map module with display options are shown below. Some of these entities also show an Options button to the right. For these entities, additional display controls are available. The available map display options include the following:
The visibility of feature objects can be controlled in this section. The following options are available:
- Node or Point – Display the vertices along the nodes or points. The button next to this option allows opening a Symbol Attributes dialog to define the size and shape of the nodes or points.
- Nodal BC or Point BC
- Refine Points
- Node or Point ID – Display the ID of the feature node or point. The button next to this option allows opening a Font dialog.
- Arcs – Display of feature arcs in the Graphics Window. The button next to this option allows opening a Line Attributes dialog where the style, width, and color of the arc can be selected.
- Arc BC – Activates an Options button that opens the Arc Display Options dialog with display options for the boundary condition specific to the active coverage.
- Vertices – Display the vertices along the arcs. The button next to this option allows opening a Symbol Attributes dialog to define the size and shape of the vertices.
- Arc ID – Display the ID of the feature arcs. The button next to this option allows opening a Font dialog.
- Arc Annotations – Displays the arc direction and station. Clicking the Options dialog will bring up the Arc Annotation Options dialog.
- Arc Types – Arc attributes may be displayed depending on the coverage.
- CL Flow Direction Arrow – Display an arrowhead showing the direction of center line arcs.
- Polygon Fill – Display the fill color of feature polygons. Generally the fill color matches the material data assigned to the polygon.
- Polygon Transparency – Sets a transparency value for the polygon fill.
- Show Materials / Mesh Type – Fill the polygons to display the materials assigned to the polygons or the mesh generation type assigned to each polygon.
- Material Opts – Set the display options of the materials.
- Land / Ocean – Set the color fill of land and ocean polygons. (Cartesian grid coverages only)
- Polygon ID – Display the ID of the feature polygons. The button next to this option allows opening a Font dialog.
- Grid Frame – Set the display of the grid frame. (Cartesian grid coverages only) The button next to this option allows opening a Line Attributes dialog where the style, width, and color of the grid frame can be selected.
- Legend
- Inactive Coverages – Set the color for the display of all inactive coverages.
Annotations
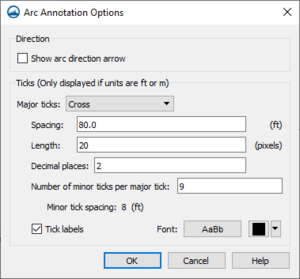
The Arc Annotation Options dialog is reached by clicking the Options button next to the Annotations options in the Map tab of the Display Options dialog. The dialog has the following options:
- Direction – This section allows turning on and off arc direction arrows.
- Show arc direction arrow – When checked on, arc direction arrows will appear on feature arcs.
- Ticks – This section allows defining tick marks on feature arcs to show the different lengths along the arc. Ticks only display if the project units are set to feet or meters. Ticks only be displayed for "Observation", "1D Cross Section", "1D Centerline" or "Plot Data" coverage types.
- Major Ticks – Major ticks can be set to be displayed in one of the following location on the arcs:
- "None" – No tick marks are displayed.
- "Cross" – Tick marks are displayed across the arc lines.
- "Left" – Tick marks are displayed only on the left side of the arc based on the arc direction.
- "Right" – Tick marks are displayed only on the right side of the arc based on the arc direction.
- Spacing – Assigns the space between major ticks.
- Length – Assigns the length of major tick marks.
- Decimal places – The number of decimal points for each major tick mark label.
- Number of minor ticks per major tick – How many minor tick marks are included between each major tick mark.
- Minor tick spacing – Show the spacing that will be used for minor tick marks.
- Tick labels – Turns on and off the tick labels. Clicking the Font button next to this option will open a Fonts dialog where the label font style can be changed.
- Major Ticks – Major ticks can be set to be displayed in one of the following location on the arcs:
Legend
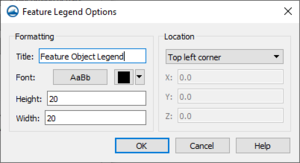
Turn the legend on or off for feature objects. The Options button opens a dialog that controls the title, font, location, and size of the legend. The Active button in this dialog signifies to show only the active coverage in the legend and the All button signifies to show all coverages in the legend. The Legend Options dialog has the following options:
- Title – Allows entering a name for the legend.
- Font – Clicking the button in this section brings up a Font dialog to set the attributes of the legend text.
- Size
- Width
- Height
- Location – Allows defining the location for the legend in the graphics window. Options include: "Top Left Corner", "Bottom Left Corner", "Top Right Corner", "Bottom Right Corner", "Screen Location", or "World Location". Using the "Screen Location" or "World Location" option will activate the X location and Y location options where a more precise location can be specified. The "World Location" option will also activate the Z location option.
Observation Coverage Only
- Calibration Target – Turn on/off calibration targets drawn next to observation points. The Interval and Two std. dev. options tell SMS to set the size of the calibration targets based on the interval or the standard deviation assigned to each point. The Scale tells SMS to scale the targets larger (>1.0) or smaller (<1.0) than the default size.
- Computed – Tells SMS to Use the active dataset or to Use the selected datasetfor displaying the calibration targets.
- Observed
Obsolete Options
The following was removed in SMS 13.1, but is available in SMS 13.0:
- Snap Preview – Turns on or off the display of the where a feature object will align along a grid or mesh. Requires that the coverage be linked to a simulation. The rules for snapping vary depending on the coverage type, therefore, the snap preview may change when switching between coverages linked to the same simulation. Shift + Q can be used to turn on or off the preview mode without entering the Display Options dialog.
Related Topics
SMS Display Options | |
|---|---|
| Modules | Mesh Module • Cartesian Grid Module • 3D Cartesian Grid Module • Scatter Module • Map Module • GIS Module • Particle Module |
| Datasets | Contour Options • Vector Options |
SMS – Surface-water Modeling System | ||
|---|---|---|
| Modules: | 1D Grid • Cartesian Grid • Curvilinear Grid • GIS • Map • Mesh • Particle • Quadtree • Raster • Scatter • UGrid |  |
| General Models: | 3D Structure • FVCOM • Generic • PTM | |
| Coastal Models: | ADCIRC • BOUSS-2D • CGWAVE • CMS-Flow • CMS-Wave • GenCade • STWAVE • WAM | |
| Riverine/Estuarine Models: | AdH • HEC-RAS • HYDRO AS-2D • RMA2 • RMA4 • SRH-2D • TUFLOW • TUFLOW FV | |
| Aquaveo • SMS Tutorials • SMS Workflows | ||


