GMS:Risk Analysis Wizard: Difference between revisions
From XMS Wiki
Jump to navigationJump to search
| Line 55: | Line 55: | ||
::[[Image:riskwizardeq1.jpg]] ......................(1) | ::[[Image:riskwizardeq1.jpg]] ......................(1) | ||
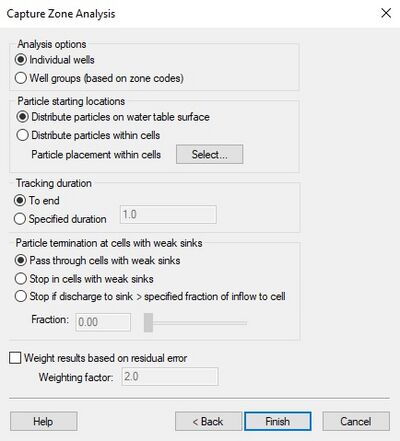
:Where W<sub>i</sub> is the weight applied to solution i, [[Image:alpha_char. | :Where W<sub>i</sub> is the weight applied to solution i, [[Image:alpha_char.png]] is a user-defined factor, ME is the mean of the error values from all solutions, E<sub>jk</sub> is the error for solution i, and SD is the standard deviation of error values from all solutions. The weights are also normalized as follows | ||
<!--[[Image:wt_final.gif]] | <!--[[Image:wt_final.gif]] | ||
<math>{\displaystyle w_{final} = \frac{w_i}{\sum w_i}}</math>--> | <math>{\displaystyle w_{final} = \frac{w_i}{\sum w_i}}</math>--> | ||
::[[Image:riskwizardeq2.jpg]] .......................(2) | ::[[Image:riskwizardeq2.jpg]] .......................(2) | ||
:so that the weights sum to unity. Equation 1 was developed to give the greater emphasis to the lower error values and to allow the user to control the relative emphasis given to low vs. high values simply by adjusting the [[Image:alpha_char. | :so that the weights sum to unity. Equation 1 was developed to give the greater emphasis to the lower error values and to allow the user to control the relative emphasis given to low vs. high values simply by adjusting the [[Image:alpha_char.png]] value. The equation also avoids problems when one of the error values is zero, since a zero error value does not result in an infinite weight. We also wanted the equation to scale the weights according to the data being examined. This is done by subtracting the individual SSWR from the mean error and dividing by the standard deviation. | ||
:Equation 1 centers the weights on the mean error. The relative weight given to values differing from the mean is biased by the factor. This makes it possible to bias the resulting weight using knowledge of the site and the quality of the observation data. | :Equation 1 centers the weights on the mean error. The relative weight given to values differing from the mean is biased by the factor. This makes it possible to bias the resulting weight using knowledge of the site and the quality of the observation data. | ||
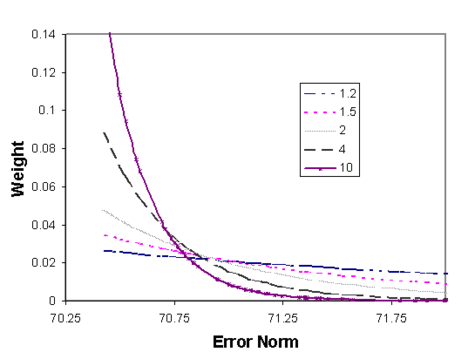
:The figure below shows how the [[Image:alpha_char. | :The figure below shows how the [[Image:alpha_char.png]] factor in Equation 1 affects the weight applied to a given error. An [[Image:alpha_char.png]] factor of 1.2 makes the contribution of each SSWR almost linear, whereas an [[Image:alpha_char.png]] factor of ten gives most of the weight to the lowest 5-10 percent while discounting the other error values. We typically use an [[Image:alpha_char.png]] value of 2.0. | ||
:[[Image:wt_plot1.png|thumb|center|475 px|''Weight versus Error Norm Plot'']] | :[[Image:wt_plot1.png|thumb|center|475 px|''Weight versus Error Norm Plot'']] | ||
