WMS:GSSHA Nutrients: Difference between revisions
| (One intermediate revision by one other user not shown) | |||
| Line 37: | Line 37: | ||
==Point Sources== | ==Point Sources== | ||
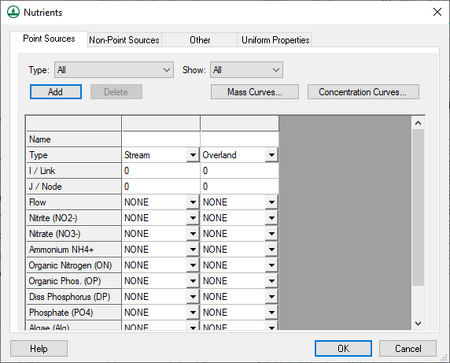
[[File:GSSHA Nutrients dialog Point Sources tab.png|thumb|right|450px|The ''Point Sources'' tab in the GSSHA ''Nutrients'' dialog.]] | [[File:GSSHA Nutrients dialog Point Sources tab.png|thumb|right|450px|The ''Point Sources'' tab in the GSSHA ''Nutrients'' dialog.]] | ||
Point sources, such as that from a discharge pipe, are defined on the ''Point Sources'' tab. When defining point sources, determine the ''I, J'' index of the cell if defining an overland point source, or the ''Link, Node'' index if defining a stream point source. The ''I, J'' index can be determined from the grid cell properties in the Properties section of the [[WMS: | Point sources, such as that from a discharge pipe, are defined on the ''Point Sources'' tab. When defining point sources, determine the ''I, J'' index of the cell if defining an overland point source, or the ''Link, Node'' index if defining a stream point source. The ''I, J'' index can be determined from the grid cell properties in the Properties section of the [[WMS:Graphical User Interface#Main Graphics Window|Main Graphics Window]]. The link number can be determined by turning on the link number display on the ''Map'' tab under "Map Data" in the [[WMS:Display Options|''Display Options'' dialog]]. | ||
For any contaminant source being modeled as a point source, a mass curve or a concentration curve must be defined in order to be selectable from the drop-downs for each contaminant. These must be entered separately from the non-point source curves. | For any contaminant source being modeled as a point source, a mass curve or a concentration curve must be defined in order to be selectable from the drop-downs for each contaminant. These must be entered separately from the non-point source curves. | ||
| Line 137: | Line 137: | ||
==Uniform Properties== | ==Uniform Properties== | ||
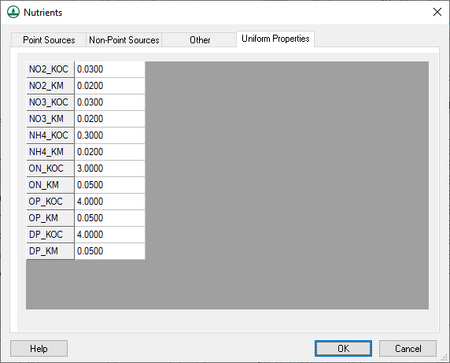
[[File:WMS GSSHA Nutrients dialog Uniform Properties tab.png|thumb|right|450 px|''Nutrients'' dialog showing the ''Uniform Properties'' tab.]] | [[File:WMS GSSHA Nutrients dialog Uniform Properties tab.png|thumb|right|450 px|''Nutrients'' dialog showing the ''Uniform Properties'' tab.]] | ||
The ''Uniform Properties'' tab contains user-editable default values for uniform nutrient properties. KOC is "the 'distribution coefficient' (Kd) normalized to total organic carbon content.<ref>{{cite web|url=https://apps.ecology.wa.gov/clarc/FocusSheets/Physical&ChemicalParameters.htm |title=Notes on Chemical-Specific Parameters – Physical and Chemical Properties |publisher=State of Washington Department of Ecology |accessdate=16 May 2019|archivedate=16 May 2019|archiveurl=http://www.webcitation.org/78QGmhE4j |deadurl=no}}</ref> KM (the Michaelis constant) is "the substrate concentration at which the reaction rate is half of its maximal value".<ref>{{cite web|url=https://www.uniprot.org/help/biophysicochemical_properties |title=Biophysicochemical properties |publisher=Uniprot Consortium |accessdate=16 May 2019 |archivedate=16 May 2019 |archiveurl=http://www.webcitation.org/78QH5PvSP |deadurl=no}}</ref> | The ''Uniform Properties'' tab contains user-editable default values for uniform nutrient properties. KOC is "the 'distribution coefficient' (Kd) normalized to total organic carbon content.<ref>{{cite web|<!--url=https://apps.ecology.wa.gov/clarc/FocusSheets/Physical&ChemicalParameters.htm--> |title=Notes on Chemical-Specific Parameters – Physical and Chemical Properties |publisher=State of Washington Department of Ecology |accessdate=16 May 2019|archivedate=16 May 2019|archiveurl=http://www.webcitation.org/78QGmhE4j |deadurl=no}}</ref> KM (the Michaelis constant) is "the substrate concentration at which the reaction rate is half of its maximal value".<ref>{{cite web|url=https://www.uniprot.org/help/biophysicochemical_properties |title=Biophysicochemical properties |publisher=Uniprot Consortium |accessdate=16 May 2019 |archivedate=16 May 2019 |archiveurl=http://www.webcitation.org/78QH5PvSP |deadurl=no}}</ref> | ||
*''NO2_KOC'' | *''NO2_KOC'' | ||
*''NO2_KM'' | *''NO2_KM'' | ||
Latest revision as of 15:45, 26 July 2024
The GSSHA Nutrients dialog is accessed by turning on Nutrients in the other options section of the GSSHA Job Control Parameters dialog, then clicking Edit parameters... to the right of the option. The following tabs are found in this dialog:
- Point Sources
- Non-Point Sources
- Other
- Uniform Properties
The following buttons are found at the bottom of the GSSHA Nutrients dialog:
- Help – Opens this article in a web browser.
- OK – Saves all changes and closes the GSSHA Nutrients dialog.
- Cancel – Discards all changes and closes the GSSHA Nutrients dialog.
General
There are a number of things that should be kept in mind regarding GSSHA nutrients
- GSSHA nutrients can only be modeled in long-term simulations.
- Create stream and grid index maps. At least one stream and one grid index map is required for nutrient setup.
- The contaminants option must be turned on with at least one contaminant in order for nutrients to run. Contaminant parameter values can be left at "0", if desired.
- A project must have at least one ID for all nutrient mapping tables for nutrients to run properly, even if the values for some IDs are all "0".
- Turn on Initial depth in the Overland flow section of the GSSHA Job Control Parameters dialog and specify an initial depth for any initial condition nutrient mapping tables to have any effect.
- Turn on any nutrient related output options in the GSSHA Output Control dialog to view the desired output datasets.
- Set up the initial conditions for the stream and grid index maps using the Nutrients map tables in the GSSHA Map Table dialog. The following map tables are supported:
- Aquatic kinetic constants
- Dispersion
- Nitrogen initial conditions
- Phosphorous initial conditions
- Carbon initial conditions
- Other initial conditions
- Soil nitrogen initial conditions
- Soil phosphorous initial conditions
- Soil carbon initial conditions
- Soil uptake rates
- Soil/water partitioning
- Groundwater nitrogen initial conditions
- Groundwater phosphorous initial conditions
- Groundwater other initial conditions
Point Sources
Point sources, such as that from a discharge pipe, are defined on the Point Sources tab. When defining point sources, determine the I, J index of the cell if defining an overland point source, or the Link, Node index if defining a stream point source. The I, J index can be determined from the grid cell properties in the Properties section of the Main Graphics Window. The link number can be determined by turning on the link number display on the Map tab under "Map Data" in the Display Options dialog.
For any contaminant source being modeled as a point source, a mass curve or a concentration curve must be defined in order to be selectable from the drop-downs for each contaminant. These must be entered separately from the non-point source curves.
The Type drop-down has the following options:
- "All" – Displays all point sources.
- "Overland" – Displays only overland point sources.
- "Stream" – Displays only stream point sources.
The Show drop-down has the following options:
- "All" – Shows all of the selected Type.
- "Selected" – Shows only those of the selected Type that are selected in the Main Graphics Window.
The following buttons appear on the Point Sources tab:
- Add – Adds a new point source to the spreadsheet on this tab.
- Delete – Immediately deletes the selected point source.
- Mass Curves... – Opens the XY Series Editor dialog to allow defining of a mass curve.
- Concentration Curves... – Opens the XY Series Editor dialog to allow defining of a concentration curve.
The spreadsheet has the following rows:
- Name – Alphanumeric field. Enter the name of the point source.
- Type – A drop-down with the following options:
- "Overland" – Select if the point source is an overland source.
- "Stream" – Select if the point source is a stream source.
- I / Link – The I coordinate (for an overland source) or the link number (for a stream).
- J / Node – The J coordinate (for an overland source) or the node number (for a stream)
- Flow – A drop-down of all available point source concentration curves.
- Nitrite (NO2-) – A drop-down of all available point source mass and concentration curves.
- Nitrate (NO3-) – A drop-down of all available point source mass and concentration curves.
- Ammonium NH4+ – A drop-down of all available point source mass and concentration curves.
- Organic Nitrogen (ON) – A drop-down of all available point source mass and concentration curves.
- Organic Phos. (OP) – A drop-down of all available point source mass and concentration curves.
- Diss Phosphorous (DP) – A drop-down of all available point source mass and concentration curves.
- Phosphate (PO4) – A drop-down of all available point source mass and concentration curves.
- Algae (Alg) – A drop-down of all available point source mass and concentration curves.
- CBOD – A drop-down of all available point source mass and concentration curves.
- Dissolved Oxygen (DO) – A drop-down of all available point source mass and concentration curves.
Non-Point Sources
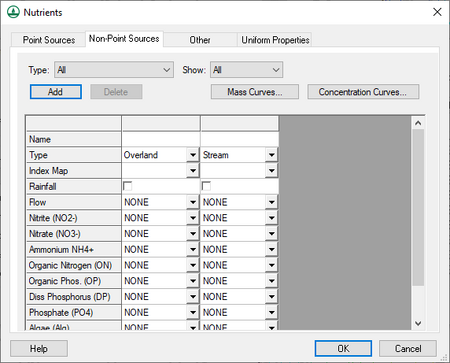
Non-point sources, such as rainfall, are defined on the Non-Point Sources tab. When defining non-point sources, define a grid or stream index map associated with the non-point source. For any contaminant source being modeled as a non-point source, a mass curve or a concentration curve must be defined in order to be selectable from the drop-downs for each contaminant. These must be entered separately from the point source curves.
The Type drop-down has the following options:
- "All" – Displays all non-point sources.
- "Overland" – Displays only overland non-point sources.
- "Stream" – Displays only stream non-point sources.
The Show drop-down has the following options:
- "All" – Shows all of the selected Type.
- "Selected" – Shows only those of the selected Type that are selected in the Main Graphics Window.
The following buttons appear on the Point Sources tab:
- Add – Adds a new non-point source to the spreadsheet on this tab.
- Delete – Immediately deletes the selected non-point source.
- Mass Curves... – Opens the XY Series Editor dialog to allow defining of a mass curve.
- Concentration Curves... – Opens the XY Series Editor dialog to allow defining of a concentration curve.
The spreadsheet has the following rows:
- Name – Alphanumeric field. Enter the name of the non-point source.
- Type – A drop-down with the following options:
- "Overland" – Select if the non-point source is an overland source.
- "Stream" – Select if the non-point source is a stream source.
- Index Map – A drop-down of all available index maps in the GSSHA project.
- Rainfall – Turn on if the non-point source is rainfall.
- Flow – A drop-down of all available non-point source concentration curves.
- Nitrite (NO2-) – A drop-down of all available non-point source mass curves.
- Nitrate (NO3-) – A drop-down of all available non-point source mass curves.
- Ammonium NH4+ – A drop-down of all available non-point source mass curves.
- Organic Nitrogen (ON) – A drop-down of all available non-point source mass curves.
- Organic Phos. (OP) – A drop-down of all available non-point source mass curves.
- Diss Phosphorous (DP) – A drop-down of all available non-point source mass curves.
- Phosphate (PO4) – A drop-down of all available non-point source mass curves.
- Algae (Alg) – A drop-down of all available non-point source mass curves.
- CBOD – A drop-down of all available non-point source mass curves.
- Dissolved Oxygen (DO) – A drop-down of all available non-point source mass curves.
Other
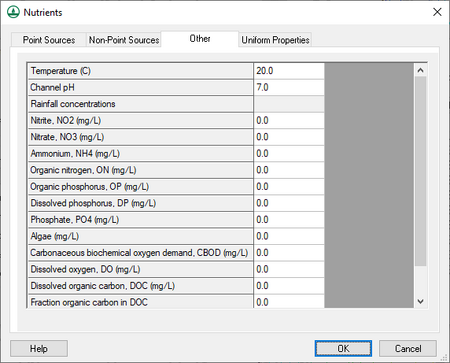
The Other tab allows nutrient concentrations to be entered. These concentrations will be applied to rainfall input.
The following rows appear in the spreadsheet on this tab:
- Temperature (C) – A decimal value in degrees Celsius.
- Channel pH – A decimal pH value.
- Nitrite, NO2 – A decimal value in milligrams per liter.
- Nitrate, NO3 – A decimal value in milligrams per liter.
- Ammonium, NH4 – A decimal value in milligrams per liter.
- Organic nitrogen, ON – A decimal value in milligrams per liter.
- Organic phosphorous, OP – A decimal value in milligrams per liter.
- Dissolved phosphorous, DP – A decimal value in milligrams per liter.
- Phsphate, PO4 – A decimal value in milligrams per liter.
- Algae – A decimal value in milligrams per liter.
- Carbonaceous biochemical oxygen demand, CBOD – A decimal value in milligrams per liter.
- Dissolved oxygen, DO – A decimal value in milligrams per liter.
- Dissolved organic carbon, DOC – A decimal value in milligrams per liter.
- Fraction organic carbon in DOC – A decimal percentage value.
Below this point, any additional contaminants created in the GSSHA Contaminants dialog will be listed.
Uniform Properties
The Uniform Properties tab contains user-editable default values for uniform nutrient properties. KOC is "the 'distribution coefficient' (Kd) normalized to total organic carbon content.[1] KM (the Michaelis constant) is "the substrate concentration at which the reaction rate is half of its maximal value".[2]
- NO2_KOC
- NO2_KM
- NO3_KOC
- NO3_KM
- NH4_KOC
- NH4_KM
- ON_KOC
- ON_KM
- OP_KOC
- OP_KM
- DP_KOC
- DP_KM
References
- ^ "Notes on Chemical-Specific Parameters – Physical and Chemical Properties". State of Washington Department of Ecology.
- ^ "Biophysicochemical properties". Uniprot Consortium. https://www.uniprot.org/help/biophysicochemical_properties. Retrieved on 16 May 2019.
GSSHA | |
|---|---|
| XMS Wiki Links | Calibration (Automated • Manual • Output) • Channel Routing • Contaminants • Digital Dams • Embankment Arcs • Feature Objects (Arcs • Nodes • Polygons) • File Types • Groundwater • Groups • Hydraulic Structures • Job Control • Join SSURGO Data • Mapping Tables • Maps • Menu • Model Linkage • Multiple Simulations • Nutrients • Observations • Output Control • Overland Soil Erosion • Pipe and Node Parameters • Precipitation • Radar Rainfall • Save GSSHA Project File • Smooth GSSHA Streams • Snowmelt • Solution (Analysis • Data) |
| Related Tools | MWBM Wizard • Using Soil Type Data with GSSHA |
| GSSHA Wiki External Links | GSSHA Wiki: Overview • Primer • User's Manual • Tutorials |
WMS – Watershed Modeling System | ||
|---|---|---|
| Modules: | Terrain Data • Drainage • Map • Hydrologic Modeling • River • GIS • 2D Grid • 2D Scatter |  |
| Models: | CE-QUAL-W2 • GSSHA • HEC-1 • HEC-HMS • HEC-RAS • HSPF • MODRAT • NSS • OC Hydrograph • OC Rational • Rational • River Tools • Storm Drain • SMPDBK • SWMM • TR-20 • TR-55 | |
| Toolbars: | Modules • Macros • Units • Digitize • Static Tools • Dynamic Tools • Drawing • Get Data Tools | |
| Aquaveo | ||


