WMS:Smooth GSSHA Streams: Difference between revisions
| Line 64: | Line 64: | ||
The ''GSSHA Thalweg'' dialog is accessible by clicking the '''Use Thalweg Data...''' button in the ''Smooth GSSHA Streams'' dialog. It contains a spreadsheet with the following columns for each row: | The ''GSSHA Thalweg'' dialog is accessible by clicking the '''Use Thalweg Data...''' button in the ''Smooth GSSHA Streams'' dialog. It contains a spreadsheet with the following columns for each row: | ||
*''Station'' – | *''Station'' – | ||
*''Elevation'' – | *''Elevation'' – The elevation of the station. | ||
At the bottom of the dialog are the following buttons: | At the bottom of the dialog are the following buttons: | ||
Revision as of 19:45, 22 May 2019
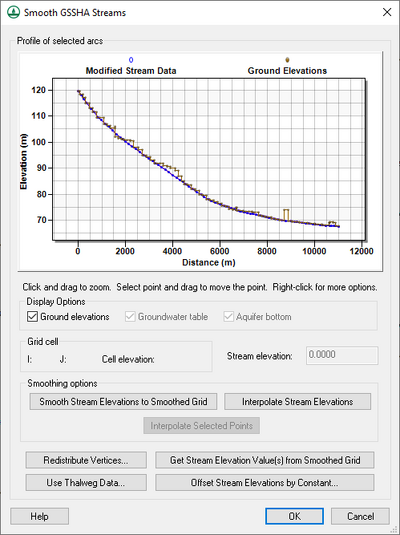
The Smooth GSSHA Streams dialog is accessible by selecting one or more reaches without branches and then selecting GSSHA | Smooth Stream/Pipe Arcs... while in the Map ![]() module. This dialog shows a profile of the bed elevations for the selected arc, allowing the individual vertices along the arc to be manipulated in multiple ways.
module. This dialog shows a profile of the bed elevations for the selected arc, allowing the individual vertices along the arc to be manipulated in multiple ways.
WMS uses a conceptual model approach to building GSSHA simulations that allows for the use of GIS data objects. Stream arcs are used to define both the spatial extent as well as the hydraulic characteristics of the streams for a GSSHA simulation in WMS. The underlying process producing the stream flow in GSSHA has been significantly updated, and the process of creating the streams in WMS has been simplified.
In WMS 6.1, a set of stream arcs were either created from a DEM or imported from a GIS shapefile. These arcs then had to be manipulated spatially to follow certain rules in order to allow WMS to correctly generate the GSSHA channel input file. Beginning with WMS 7.0, the stream arcs no longer need to be spatially manipulated. However, the streambed profile still needs to be checked and corrected using the Smooth GSSHA Streams dialog.
Stream Arc Topology Rules
There are topological rules for stream arc connectivity that must be adhered to in order produce a valid channel input file:
- Stream arcs must be connected from downstream to upstream.
- There should not be any braids or multiple downstream channels from an upstream reach.
- Starting with GSSHA 2.0 (released about 2007), there may be more than two upstream reaches from any particular reach (e.g., three reaches may converge to become a single reach).
Stream Smoothing
An essential part of building the stream network is making sure that the streambed will flow as it should. Obtaining the stream network from a DEM can leave many artificial ridges and pits in the streambed profile that force water to pond. This ponding is also known as digital damming. When a stream network is imported from a shapefile, the streams have often been digitized from a topographical map, and the streambed may be lacking elevation values. The Smooth GSSHA Streams dialog provides a place to check for and solve these problems.
All of the options in this dialog are contained within the Profile of selected arcs section. At the top of this section is a plot showing arcs for ground elevations and modified stream data.
The arcs on the plot can be manually modified in the following ways:
- Click and drag to create a zoom box. Release the mouse button to zoom in.
- Select a plot point on either arc and vertically drag it to change its elevation.
- Right-click on the plot to bring up the following menu options:
- Display Options... – Brings up the Customization dialog.
- Axis Titles... – Brings up the Axis Titles dialog.
- Set As Display Defaults – Takes the current plot display settings and makes them the default in WMS.
- Symbol Size – Adjust the size of the symbols used at each plot point. Opens a sub-menu with the following options:
- Micro
- Small
- Medium
- Large
- Frame Plot – Zooms to the extents of the plot.
- Maximize Plot – Makes the plot fill the full extent of the monitor or screen. When done viewing the plot in this manner, press Esc or click at the top left corner of the screen where prompted.
- View Values... – Opens the View Values dialog.
- Export/Print... – Opens the Exporting dialog.
- Double-click on the plot to bring up the Customization dialog.
The Display Options section has the following options:
- Ground elevations – Turn on to display the ground elevations.
- Groundwater table – Turn on to display the groundwater table. Only changeable if applicable.
- Aquifer bottom – Turn on to display the aquifer bottom. Only changeable if applicable.
The Grid cell section displays I, J coordinates and the cell elevation for the selected plot point. To the right of that is Stream elevation, which displays the current stream bed elevation. This field is user-editable.
The Smoothing options section allows the stream bed profile arc and the stream arc to be modified to allow water to flow naturally. It has the following buttons:
- Smooth Stream Elevations to Smoothed Grid – A warning appears advising that vertices may be inserted and the selected stream arcs may be permanently changed. Clicking OK will finish the modification, and clicking Cancel will stop the modification. The stream will be conformed to lie on the surface of the grid, but it will not spatially change.. To accommodate this, additional vertices may be added where the grid changes slope. These vertices will be linearly interpolated from the existing vertices. The additional vertices can make the stream arc more difficult to manually manipulate.
- Interpolate Stream Elevations – A modified version of the stream-smoothing algorithm proposed by Ogden, Saghafian, and Krajewski[1] implemented in WMS 6.1. This option constrains junction nodes to be lower than the next upstream vertex on the offshoot branch.
- Interpolate Selected Points – At least stream bed points must be selected.
Below the smoothing options are the following buttons:
- Redistribute Vertices... – Opens the Redistribute Vertices dialog.
- Get Stream Elevation Value(s) from Smoothed Grid –
- Use Thalweg Data... – Opens the GSSHA Thalweg dialog.
- Offset Stream Elevations by Constant... – Opens the Stream offset dialog.
The following buttons are found at the bottom of the dialog:
- Help – Opens this article in a web browser.
- OK – Saves all changes and closes the Smooth GSSHA Streams dialog.
- Cancel – Discards all changes and closes the Smooth GSSHA Streams dialog.
GSSHA Thalweg
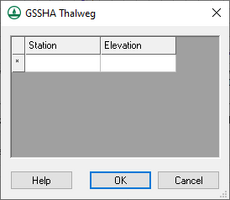
The GSSHA Thalweg dialog is accessible by clicking the Use Thalweg Data... button in the Smooth GSSHA Streams dialog. It contains a spreadsheet with the following columns for each row:
- Station –
- Elevation – The elevation of the station.
At the bottom of the dialog are the following buttons:
- Help – Opens this article in a web browser.
- OK – Saves all changes and closes the GSSHA Thalweg dialog.
- Cancel – Discards all changes and closes the GSSHA Thalweg dialog.
References
- ^ Ogden, Fred L.; Saghafian, Bahram; Krajewski, Witold F. (1994). "GIS-Based Channel Extraction and Smoothing Algorithm for Distributed Hydrologic Modeling". https://cedb.asce.org/CEDBsearch/record.jsp?dockey=0089387. Retrieved on May 22, 2019.
GSSHA | |
|---|---|
| XMS Wiki Links | Calibration (Automated • Manual • Output) • Channel Routing • Contaminants • Digital Dams • Embankment Arcs • Feature Objects (Arcs • Nodes • Polygons) • File Types • Groundwater • Groups • Hydraulic Structures • Job Control • Join SSURGO Data • Mapping Tables • Maps • Menu • Model Linkage • Multiple Simulations • Nutrients • Observations • Output Control • Overland Soil Erosion • Pipe and Node Parameters • Precipitation • Radar Rainfall • Save GSSHA Project File • Smooth GSSHA Streams • Snowmelt • Solution (Analysis • Data) |
| Related Tools | MWBM Wizard • Using Soil Type Data with GSSHA |
| GSSHA Wiki External Links | GSSHA Wiki: Overview • Primer • User's Manual • Tutorials |
WMS – Watershed Modeling System | ||
|---|---|---|
| Modules: | Terrain Data • Drainage • Map • Hydrologic Modeling • River • GIS • 2D Grid • 2D Scatter |  |
| Models: | CE-QUAL-W2 • GSSHA • HEC-1 • HEC-HMS • HEC-RAS • HSPF • MODRAT • NSS • OC Hydrograph • OC Rational • Rational • River Tools • Storm Drain • SMPDBK • SWMM • TR-20 • TR-55 | |
| Toolbars: | Modules • Macros • Units • Digitize • Static Tools • Dynamic Tools • Drawing • Get Data Tools | |
| Aquaveo | ||

