WMS:GSSHA Maps
The GSSHA Maps dialog allows for setting various options and parameters for how index maps (for both grids and streams) and continuous maps are used in GSSHA simulations. The dialog is accessed by switching to the 2D Grid ![]() module and selecting GSSHA | Maps... to bring up the dialog.
module and selecting GSSHA | Maps... to bring up the dialog.
This dialog has three tabs:
- Index – Grid – For index maps associated with grids.
- Index – Stream – For index maps associated with streams.
- Continuous – Grid – For continuous maps associated with grids.
At the bottom of the dialog are two buttons:
- Help – Clicking this button opens this page in a web browser.
- Done – Saves any changes and exits the GSSHA Maps dialog.
Grid Index Maps
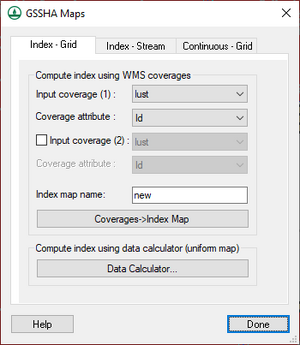
The Index – Grid tab has the following sections and options:
- Compute index using WMS coverages
- Input coverage (1) – A drop-down menu of applicable coverages in the project.
- Coverage attribute – A drop-down menu of attributes to which the first coverage will be associated.
- Input coverage (2) – Turn on to activate a second drop-down menu of applicable coverages in the project. Optional.
- Coverage attribute – A drop-down menu of attributes to which the second coverage will be associated. Only accessible if Input coverage (2) is turned on.
- Index map name – An alphanumeric field where the name of the new index map can be entered.
- Coverages→Index Map – Clicking this button maps the selected coverages to the new index map.
- Compute index using data calculator (uniform map) section – Clicking Data Calculator... brings up the Data Calculator dialog.
One of the greatest assets of distributed hydrologic models like GSSHA is the ability to spatially distribute the parameters for processes, such as overland flow and infiltration, over the watershed. Assigning values, grid cell by grid cell, is tedious and makes all but the simplest and smallest models impossible. Using WMS, GIS coverages (layers) representing land use and soil texture can be used to assign model parameter values to groups of grid cells sharing the same characteristics.
The basic process of assigning spatially distributed parameters consists of the following steps:
- Import a GIS coverage for land use, soil texture, or vegetation type (generally, this should be in the ArcView® shapefile format).
- Map the land use, soil texture, or vegetation ID to the grid cells using a spatial overlay operation.
- Define parameter values (e.g., surface roughness, hydraulic conductivity, etc.) for the unique ID numbers.
A given soil texture/land use (STLU) index map can be used to assign multiple parameters. Since most of the grid cell parameters can be referenced to either land use or soil properties, a given simulation generally requires only a single index map of each. A combination land use and soil texture index map makes it possible to relate a parameter value to the combination of land use and soil texture (for example infiltration or erosion). Once the index maps are defined, parameter values are assigned to the IDs of the index maps. The combination of the index maps, with ID numbers, and the mapping tables, with the parameter values, are used by GSSHA to internally assign parameter values to each grid cell.
The principle means of modifying and creating index maps is in the Index Map dialog but the index maps are now also able to be accessed through the Project Explorer. When an index map has been created or imported into WMS a folder appears in the Project Explorer, named Index Maps, that contains all of the index maps for the simulation. Index maps can then be treated like regular datasets; they can be contoured, renamed, deleted, and edited.
Stream Index Maps
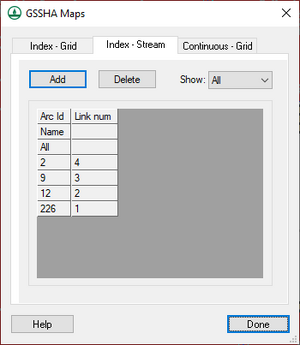
The Index – Stream tab has the following sections and options:
- Add – Add a new stream index column.
- Delete – Immediately delete the selected stream index column.
- Show – Drop-down menu with the following options:
- "All" – Show all stream arcs.
- "Selected" – Show only selected stream arcs.
Sometimes, a project might have a stream-based index map instead of a grid-based index map. When defining a stream index map, define an index value greater than zero for each link in the model. There is not currently an option to automatically define stream index map values from grid or map module data.
Turn on stream link IDs by opening the Display Options dialog, selecting "Map Data" from the list on the left, and turning on Stream Link Numbers on the Map tab. Next, assign index values to each of the stream links in the model. Then use stream index maps to define Manning's roughness, nutrient values, and other values in the GSSHA Map Table Editor dialog.
Grid Continuous Maps
Some GSSHA input parameters change from cell to cell and cannot be characterized using index maps. Continuous maps, which are stored as datasets of a 2D grid in WMS, are used where index maps are not appropriate.
Examples of GSSHA input parameters that use continuous maps include soil properties for the groundwater processes and ground surface, bedrock, and water table elevations. Contours for each of the continuous maps are displayed on the 2D grid according to the contour options selected for the dataset. Continuous maps are specified as GSSHA input in either the GSSHA Groundwater dialog or in the Continuous Maps tab of the GSSHA Map Table Editor dialog.
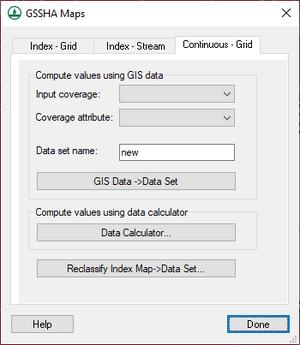
There are three section which allow generating continuous maps using different methods:
- Compute values using GIS data section
- Input coverage – Select an input coverage from the drop-down.
- Coverage attribute – Select the desired coverage attribute from the drop-down.
- Dataset name – Alphanumeric field. Enter the desired name for the new continuous map.
- GIS Data → Dataset – After the above three fields have been specified, click this button to create the new continuous map dataset.
- Compute values using data calculator – Click Data Calculator... to bring up the Data Calculator dialog. This option is useful for mathematically manipulating existing continuous maps.
- Reclassify Index Map → Dataset... – Clicking this button brings up the Reclassify Index Map dialog.
Reclassify Index Map Dialog
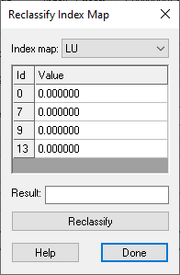
The Reclassify Index Map dialog is accessed via the Reclassify Index Map → Dataset... button on the Continuous – Grid tab of the GSSHA Maps dialog. It allows non-destructive (the original index map is retained) reclassification of index map values to create a new continuous map. It has the following options:
- Index map – Drop-down of all available index maps within the GSSHA project. Select the desired index map to reclassify.
- Spreadsheet – The spreadsheet has Id and Value columns. The data displayed varies, depending on the index map selected from the above drop-down.
- Result – Alphanumeric field. Enter the desired name for the new continuous map.
- Reclassify – Click this button to create the new continuous map based on the options selected above.
There are two additional buttons at the bottom of the Reclassify Index Map dialog:
- Help – Clicking this button will open this article in a web browser.
- Done – Closes the Reclassify Index Map dialog.
| [hide] GSSHA | |
|---|---|
| XMS Wiki Links | Calibration (Automated • Manual • Output) • Channel Routing • Contaminants • Digital Dams • Embankment Arcs • Feature Objects (Arcs • Nodes • Polygons) • File Types • Groundwater • Groups • Hydraulic Structures • Job Control • Join SSURGO Data • Mapping Tables • Maps • Menu • Model Linkage • Multiple Simulations • Nutrients • Observations • Output Control • Overland Soil Erosion • Pipe and Node Parameters • Precipitation • Radar Rainfall • Save GSSHA Project File • Smooth GSSHA Streams • Snowmelt • Solution (Analysis • Data) |
| Related Tools | MWBM Wizard • Using Soil Type Data with GSSHA |
| GSSHA Wiki External Links | GSSHA Wiki: Overview • Primer • User's Manual • Tutorials |
| [hide] WMS – Watershed Modeling System | ||
|---|---|---|
| Modules: | Terrain Data • Drainage • Map • Hydrologic Modeling • River • GIS • 2D Grid • 2D Scatter |  |
| Models: | CE-QUAL-W2 • GSSHA • HEC-1 • HEC-HMS • HEC-RAS • HSPF • MODRAT • NSS • OC Hydrograph • OC Rational • Rational • River Tools • Storm Drain • SMPDBK • SWMM • TR-20 • TR-55 | |
| Toolbars: | Modules • Macros • Units • Digitize • Static Tools • Dynamic Tools • Drawing • Get Data Tools | |
| Aquaveo | ||


