WMS:GSSHA Digital Dams: Difference between revisions
No edit summary |
|||
| (9 intermediate revisions by 3 users not shown) | |||
| Line 1: | Line 1: | ||
Digital dams occur where a stream leaves a cell at or near a corner. Since flow occurs between adjacent cells and not between diagonal cells, the stream leaving at the cell corner leaves behind two stream banks adjacent to the flowing cell. These two stream banks block the overland flow, which can create numerical instabilities and will pool up the flowing water behind the banks. WMS | [[File:GSSHA_flow_vectors.png|thumb|right|Digital dams visible with flow vectors turned on.]] | ||
[[File:GSSHA_Cell_Fill_Block_Style_Digital_Dams.jpg|thumb|right|Digital dams visible with blocked cells turned on.]] | |||
Digital dams occur where a stream leaves a cell at or near a corner. Since flow occurs between adjacent cells and not between diagonal cells, the stream leaving at the cell corner leaves behind two stream banks adjacent to the flowing cell. These two stream banks block the overland flow, which can create numerical instabilities and will pool up the flowing water behind the banks. WMS has multiple ways to visualize and modify digital dams in the overland flow plane. | |||
==Visualization== | |||
WMS | Digital dam visualization options in WMS are accessible on the ''2D Grid'' tab of the [[WMS:Display Options|''Display Options'' dialog]]. Turn on the ''Digital Dams'' option to have WMS identify digital dams by looking for cells that are lower than their four neighbors. The identified cells will be indicated by a small square marker in the middle of the cell. | ||
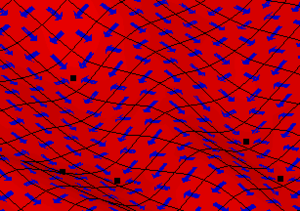
Turn on the ''Flow Vectors'' option to have WMS displays flow direction arrows between cells based only on the differences in cell elevation. GSSHA computes overland flow based on the hydraulic grade surface, but this is often approximately equal to the elevation surface. | |||
A grid is shown with flow vectors (blue arrow) and digital dam markers (black squares). The flow vectors show the direction of flow between adjacent cells. A digital dam occurs when all four flow direction arrows indicate flow only coming into cell and not leaving the cell. These cells are indicated with the small square marker. | |||
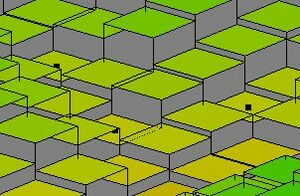
Another method to help visualize the computational flow surface where the digital dams are is to select ''Blocked'' under the ''Cells'' option on the "2D Grid" tab in the ''Display Options'' dialog. Blocked cells treat each grid as a planar surface and draw them as such. A vertical line is drawn connecting the cell corners. Blocked cells are often used in combination with cell-filled contours. | |||
The cells can be drawn in a block style that affords greater visualization of the computational surface. The black squares indicate cells where digital dams exist. The cells in this diagram (right) are also cell filled, meaning that the full cell is colored in only one color based on the elevation at the center of the cell. | |||
==Modification== | |||
There are two ways of fixing digital dams in WMS. | |||
The | The first method is to run the CleanDam algorithm by selecting ''GSSHA'' | '''Clean Digital Dams...''' to bring up the [[WMS:Model Wrapper|''Model Wrapper'' dialog]]. CleanDam slightly alters the cell elevations in order to fix the digital dams. A summary of the CleanDam results can be viewed before closing the ''Model Wrapper'' dialog. WMS automatically imports the new elevations and replaces the existing elevation dataset. | ||
A polygon can be designated as a "Depression Mask" polygon in a GSSHA type coverage by using the [[WMS:GSSHA Feature Polygons|''Polygon Attributes'' dialog]]. This designation masks cells contained within the designated polygon and prevents the elevations of the cells located inside it from being altered when the CleanDam program is run from WMS. The [[WMS:2D Grid Display Options|2D Grid Display Options]] can allow display of the 2D grid cells located within depression mask polygons. | |||
The other method of correcting any remaining digital dams is to manually adjust the cell elevations. Changing the grid resolution can sometimes help eliminate digital dams. | |||
The other method of correcting any remaining digital dams is to manually adjust the cell elevations. | |||
==Related Topics== | ==Related Topics== | ||
* [[WMS:2D Grid Display Options|2D Grid Display Options]] | * [[WMS:2D Grid Display Options|2D Grid Display Options]] | ||
}} | {{GSSHA Wiki}} | ||
{{WMSMain}} | |||
[[Category:GSSHA|D]] | [[Category:GSSHA|D]] | ||
Latest revision as of 21:27, 10 May 2019
Digital dams occur where a stream leaves a cell at or near a corner. Since flow occurs between adjacent cells and not between diagonal cells, the stream leaving at the cell corner leaves behind two stream banks adjacent to the flowing cell. These two stream banks block the overland flow, which can create numerical instabilities and will pool up the flowing water behind the banks. WMS has multiple ways to visualize and modify digital dams in the overland flow plane.
Visualization
Digital dam visualization options in WMS are accessible on the 2D Grid tab of the Display Options dialog. Turn on the Digital Dams option to have WMS identify digital dams by looking for cells that are lower than their four neighbors. The identified cells will be indicated by a small square marker in the middle of the cell.
Turn on the Flow Vectors option to have WMS displays flow direction arrows between cells based only on the differences in cell elevation. GSSHA computes overland flow based on the hydraulic grade surface, but this is often approximately equal to the elevation surface.
A grid is shown with flow vectors (blue arrow) and digital dam markers (black squares). The flow vectors show the direction of flow between adjacent cells. A digital dam occurs when all four flow direction arrows indicate flow only coming into cell and not leaving the cell. These cells are indicated with the small square marker.
Another method to help visualize the computational flow surface where the digital dams are is to select Blocked under the Cells option on the "2D Grid" tab in the Display Options dialog. Blocked cells treat each grid as a planar surface and draw them as such. A vertical line is drawn connecting the cell corners. Blocked cells are often used in combination with cell-filled contours.
The cells can be drawn in a block style that affords greater visualization of the computational surface. The black squares indicate cells where digital dams exist. The cells in this diagram (right) are also cell filled, meaning that the full cell is colored in only one color based on the elevation at the center of the cell.
Modification
There are two ways of fixing digital dams in WMS.
The first method is to run the CleanDam algorithm by selecting GSSHA | Clean Digital Dams... to bring up the Model Wrapper dialog. CleanDam slightly alters the cell elevations in order to fix the digital dams. A summary of the CleanDam results can be viewed before closing the Model Wrapper dialog. WMS automatically imports the new elevations and replaces the existing elevation dataset.
A polygon can be designated as a "Depression Mask" polygon in a GSSHA type coverage by using the Polygon Attributes dialog. This designation masks cells contained within the designated polygon and prevents the elevations of the cells located inside it from being altered when the CleanDam program is run from WMS. The 2D Grid Display Options can allow display of the 2D grid cells located within depression mask polygons.
The other method of correcting any remaining digital dams is to manually adjust the cell elevations. Changing the grid resolution can sometimes help eliminate digital dams.
Related Topics
GSSHA | |
|---|---|
| XMS Wiki Links | Calibration (Automated • Manual • Output) • Channel Routing • Contaminants • Digital Dams • Embankment Arcs • Feature Objects (Arcs • Nodes • Polygons) • File Types • Groundwater • Groups • Hydraulic Structures • Job Control • Join SSURGO Data • Mapping Tables • Maps • Menu • Model Linkage • Multiple Simulations • Nutrients • Observations • Output Control • Overland Soil Erosion • Pipe and Node Parameters • Precipitation • Radar Rainfall • Save GSSHA Project File • Smooth GSSHA Streams • Snowmelt • Solution (Analysis • Data) |
| Related Tools | MWBM Wizard • Using Soil Type Data with GSSHA |
| GSSHA Wiki External Links | GSSHA Wiki: Overview • Primer • User's Manual • Tutorials |
WMS – Watershed Modeling System | ||
|---|---|---|
| Modules: | Terrain Data • Drainage • Map • Hydrologic Modeling • River • GIS • 2D Grid • 2D Scatter |  |
| Models: | CE-QUAL-W2 • GSSHA • HEC-1 • HEC-HMS • HEC-RAS • HSPF • MODRAT • NSS • OC Hydrograph • OC Rational • Rational • River Tools • Storm Drain • SMPDBK • SWMM • TR-20 • TR-55 | |
| Toolbars: | Modules • Macros • Units • Digitize • Static Tools • Dynamic Tools • Drawing • Get Data Tools | |
| Aquaveo | ||

